
Antifraud is no longer just about “catching bad clicks.” It’s about understanding what’s happening with your traffic.
“At Kaminari Click we believe: antifraud is not just a blocking tool. It’s analytics that shows where you’re losing money — and why.”
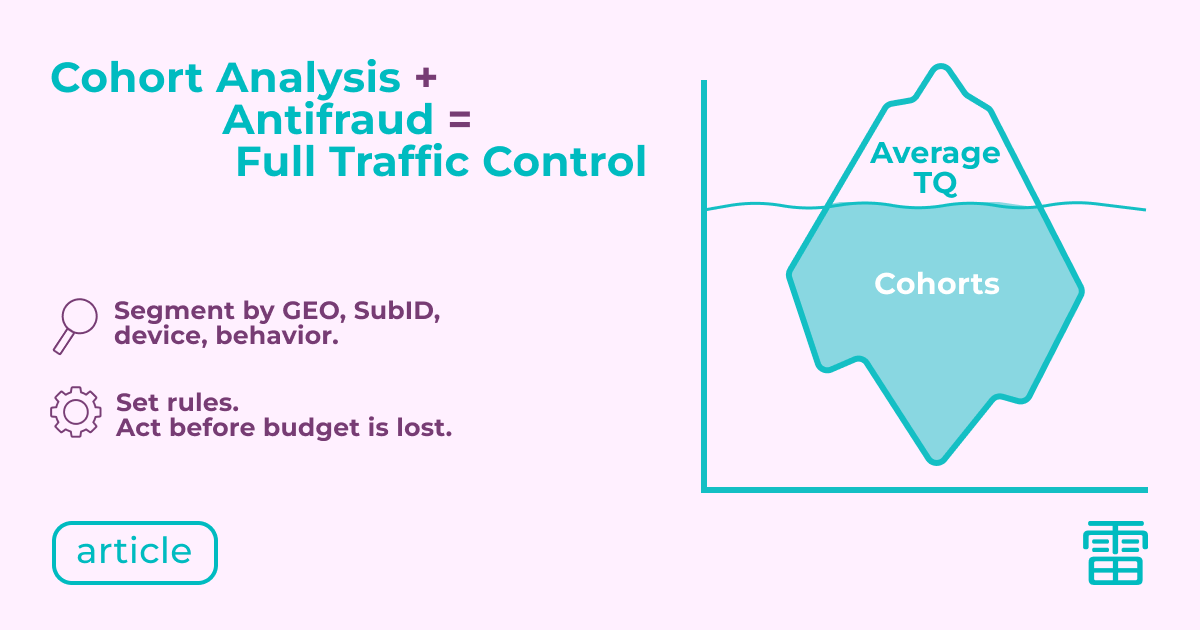
If you only look at the “fraud percentage,” you’re seeing just the tip of the iceberg. But what’s going on below the surface — where the real budget drain happens — remains out of sight.
Cohort analysis allows you to look at traffic deeper. To see not just clicks, but the behavior of whole traffic groups over time, by source, geo, and device.

What is cohort analysis, to the point
A cohort is a group of clicks united by a common attribute:
- launch date
- subID
- GEO
- device type
- behavior (e.g., proxy activity)
The cohort approach is not “just another data slice”. It’s a tool that helps you understand exactly who is sending fraud, not just that “something somewhere dropped.”
Why average values are misleading
Here’s a classic case:
Everything looks okay — average TQ is 65%. But when you look at the cohort “new subs from GEO X”, there’s only 12% clean traffic. And that’s exactly where most of the budget is going.
Without cohort analysis, you simply don’t see this. Everything seems “okay on average.” And this is where the combo comes in: antifraud + cohort analysis. Now it’s about systematically working with quality — not reacting to isolated incidents.
How antifraud helps build cohorts
A modern antifraud system is not just a “stop button.” It’s a full data collector. In Kaminari Click, we track:
- IP, user-agent, device ID, fingerprint
- click speed and path
- suspicious behavior and proxy activity
Every click — in full view. And most importantly: you can group clicks into cohorts by any parameters, then watch how they behave — in real time and over time.
How cohort analysis helps in practice
Disabling fraudulent subs before losses
One day — one sub ID. The cohort showed 87% fraud. Decision made to disable — budget saved.
A/B testing of sources
Two feeds were tested. Cohort analysis over 72 hours showed a +240% spike in proxy activity in one of them. Quick decision, no longer “investigations.”
Detection of “danger time zones”
Click fraud spiked at night in certain geos. Set up time filtering. One less problem.
What cohort analysis gives you in Kaminari Click
- Quick breakdown of traffic by subs, offers, devices, countries
- Tracking traffic quality changes over time
- Retest — reanalyze the behavior of already filtered clicks
- Export all data to Excel or BI
- Custom rules and automation based on cohorts
It’s not just about “viewing data” — it’s managing traffic like a pro.
Why this matters for ad networks
Transparency for advertisers: you can show that sources are under control, there’s analytics and understanding.
Basis for refunds: when you have a cohort with specific numbers — it’s no longer “we think there was fraud,” it’s “here are the numbers, here’s the sub, here’s the time.”
Foundation for automation: set up alerts and auto-disables by specific parameters — and sleep well.
Bottom line: want to see how it works on your traffic?
If you still don’t see your traffic in cohorts — someone else probably does.
Want to take control? Book a demo — we’ll run a test for you with zero noise.
